Driving Data-Driven Retail Efficiency Through IoT-UX

Confidential Project – Smart Retail Platform | Role: Lead UX Researcher & Strategist

#UXResearch #EnterpriseUX #DataDriven #RetailEffeciency
Man wearing helmet holding a bottle and using a tablet device in an oil field with oil pumps in the background during sunset

PROJECT SUMMARY

“Redesigned a mission-critical field platform for improved chemical sampling, delivery, and inventory tracking—resulting in a 45% faster task completion rate and 50% better asset discoverability.”

🧩 PROBLEM STATEMENT

Industry leader in beverage dispensing innovation with over 50 years of experience. Faced lack of real-time control and visibility across distributed store locations.

Key challenges for different user roles:

  • Admins: Struggled with delayed and incomplete reporting.
  • Store Managers: Faced inconsistent equipment configurations.
  • Technicians: Operated with reactive, rather than proactive, maintenance.

Needed a centralized, IoT-enabled web platform to:

  • Provide real-time, actionable insights
  • Empower all user roles with relevant data
  • Streamline workflows and improve operational efficiency
Oil field engineer wearing a helmet and holding a sample container with oil pumps in the background at sunset

🎯MY ROLE

As Senior UX Researcher, I led multi-stakeholder research—from executive dashboards to technician workflows—driving UX vision through data synthesis, stakeholder facilitation, and iterative validation.

Mockups

Prototype Link

🔍 RESEARCH PROCESS

  • Stakeholder Interviews: Spoke with organizational admins, store managers, and service technicians across 5 regions.
  • Data Usage Analysis: Mined platform telemetry to uncover gaps in configuration usage, report generation, and technician response times.
  • Field Testing: Conducted A/B tests and shadowing sessions to validate design iterations in live retail environments.
  • Collaborative Workshops: Facilitated journey mapping and feature co-prioritization with product, engineering, and support leads.

KEY FINDINGS

  • Admins spent Excessive hours manually compiling store-level sales reports.
  • Store managers faced confusion configuring cup/flavor variants, causing pricing errors.
  • Equipment teams lacked proactive diagnostic visibility, leading to avoidable downtime.

🎨 DESIGN OUTCOMES

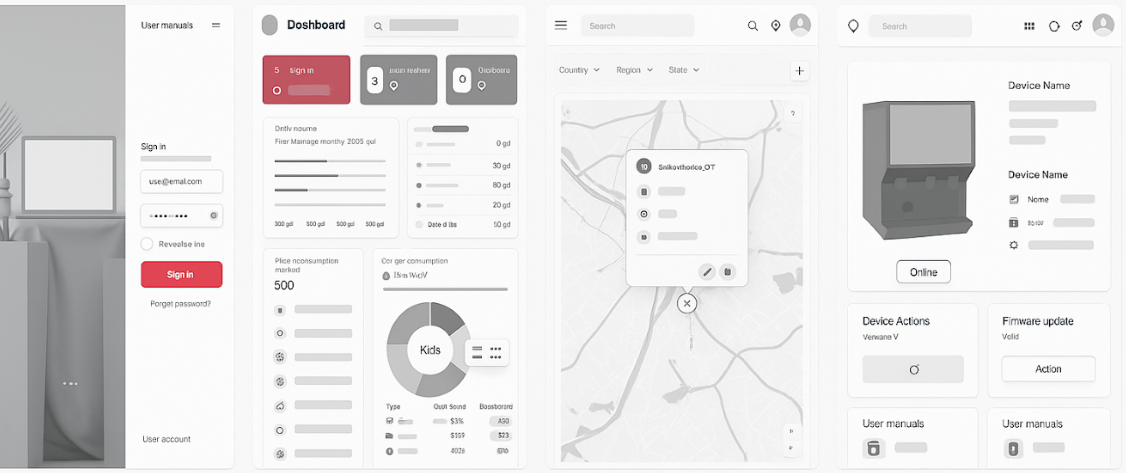
  • Real-Time Dashboards: Delivered multi-level data visualizations (region → store → SKU) with exportable reports.
  • Smart Configuration UI: IBuilt intuitive wizards for setting pricing, cup sizes, and flavor profiles—reducing errors and calls to support.
  • Predictive Maintenance UX: Designed technician dashboard with predictive alerts, log-based part tracking, and responsive mobile views.

📊 IMPACT

  • 📈 40% reduction in manual report generation time
  • 🕒 25% faster access to brand & flavor performance trends
  • 💡 30% increase in configuration accuracy
  • 🚫 20% reduction in inventory waste
  • 🛠️ 40% decrease in equipment downtime
  • 50% improvement in technician response times

🔗 STRATEGIC VALUE

By delivering a seamless, role-specific UX layer across a connected IoT infrastructure, this project exemplified designing for multi-user ecosystems, predictive maintenance UX, and data-driven decision-making interfaces—hallmarks of 2025’s most advanced retail experiences.